
When you are examining a chart or graph in Task 1 of the IELTS writing test, look for highest values, lowest values and similar values. If the chart or graph shows how something changed over time, look for the biggest and smallest changes, as well as anything that did not change much over the period.
This will highlight the most significant features you need to describe in your answer. If there are two or more graphs, think about the relationship between them. Remember, you don’t have to explain why anything happened, but you do need to describe what happened.
Take a look at this example, then check out our advice on how to answer the question and finally our sample answer.
Task - Do the following writing task.
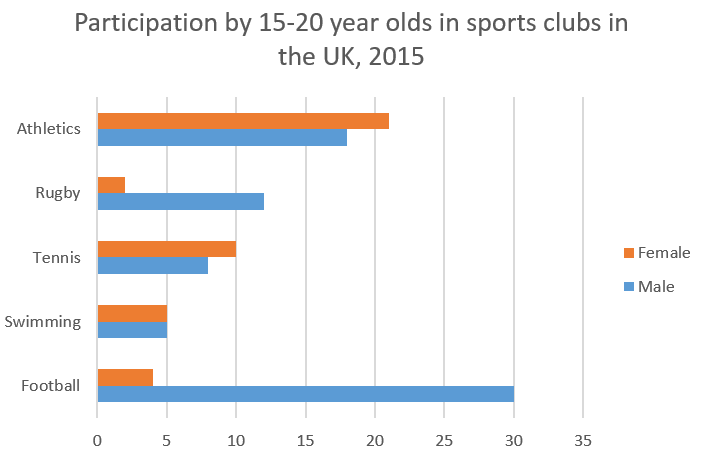
The chart shows the percentage of young people participating in sports clubs by gender in the UK in the year 2015. Write a report for a university lecturer describing the information below. You should write at least 150 words.
You should write at least 150 words.
Advice on how to complete this task
Before you write
Before you write
- First, scan the table and look for high values and differences between males and females.
- Make some notes of the main points you want to include.
- Make sure you write about all the categories of sport, even just briefly for some, otherwise you will lose marks on task achievement.
Some other advice and suggestions:
Start with an opening sentence which describes what the chart shows, but not copying the question paper. For example, you could write “The bar chart illustrates the percentage involvement of males and females aged 15-20 years old in sports clubs in Britain in 2015.”
First look for any differences between male and female participation. It should be noted that boys are much more involved in sports than girls in general.
Then look for the high figures as it makes more sense to describe those first, rather than minor involvement. You could mention the boys participation in football first as that is the highest, then the similar high involvement of boys and girls in athletics.
Mention the lower figures briefly using words like minimal. For example “There was minimal interest in swimming (5% for both male and female)“.
Close with a recap of the general observation.
Sample answerThe bar chart illustrates the percentage involvement of males and females aged 15-20 years old in sports clubs in Britain in 2015. The sports detailed in the chart are athletics, rugby, tennis, swimming and football.Generally speaking, males are much more involved in sports clubs than females, especially in football, which ranks the highest percentage participation of all, with nearly one-third (30%) for males but only 4% for females. Ranking second in popularity is athletics, which displays a closer involvement of males and females than football, with females participating marginally more than males; 21% for females and only 18% for males. The third most popular sport is rugby, showing a relatively high involvement for men, whereas only 2% of women play rugby. Women appear to be keener on tennis than men as the chart indicates 10% participation compared to 8% for men. There was minimal interest in swimming; 5% for both male and female. Overall, the interest in sports clubs is dominated by men.(164 words)